Vacation Rental Profit Calculator for Airbnb, VRBO & Booking.com

AirDNA tells you what the market earns. This tool tells you what you keep — after platform fees, mortgage, cleaning, taxes, and every cost in between.

100% Offline — No cloud. No account.
3 Platforms + Direct Booking
Full P&L — Not just fees
Calculate My Real Profit →

No subscription · One-time download · Open the file, see your profit

Single-Booking Fee Comparison

Before you assemble the all-in-one profit picture this hub is built for, start with one booking. The quick comparison below takes a single stay and shows what you'd actually keep on Airbnb, VRBO, and Booking.com after each platform's host fee — so you can see how the very same reservation pays out three different ways. It's a fee-only snapshot; the operating-cost, tax, and seasonal layers live in the downloadable calculator further down the page.

Gross booking value: $540.00  (nightly rate × nights + cleaning fee)

Airbnb
Net Payout to Host
$523.80
Effective Fee
3.00%
Host fee 3% (guest pays ~14% on top, separately)
VRBO
Net Payout to Host
$496.80
Effective Fee
8.00%
Pay-per-booking: 5% commission + 3% payment = 8%
Booking.com
Net Payout to Host
$459.00
Effective Fee
15.00%
Standard 15% commission, Virtual Card (no extra payment fee)

This compares one booking on platform fees alone. The full Vacation Rental Profit Calculator goes further — monthly profit & loss with operating costs and taxes, 12-month seasonal planning, and multi-property bulk-CSV import/export.

Get the Full Calculator →

Most Hosts Don't Know Their Real Break-Even Occupancy Rate

The fee layers add up fast. You list at $150/night and assume that's profit. After Airbnb's 15.5% host fee, cleaning costs, mortgage allocation, insurance, and local occupancy taxes — the real number looks very different.
Market tools don't calculate your costs. AirDNA costs $40/month. Mashvisor $52/month. Both are market research tools — they don't tell you your actual profit. They tell you what similar properties earn before expenses.
Which platform actually pays more? Airbnb, VRBO, Booking.com, or direct bookings? Most hosts list on one platform and never run the comparison.
The Solution
This tool calculates your complete P&L — instantly, offline, in a single HTML file.
Platform fees (Airbnb, VRBO, Booking.com, direct)
Occupancy taxes & auto-collection toggle
Mortgage, insurance, HOA, utilities
Cleaning costs, laundry, supplies
→ Net income you actually keep

Everything a Vacation Rental Host Actually Needs

Platform Comparison Mode

Same property. Same occupancy. Compare Airbnb (3% or 15.5%), VRBO (8% or $499/year subscription), Booking.com (10–25% + Genius discount), and direct bookings side by side. See which platform nets you more — annually.

Break-Even Occupancy Calculator

The most important number every host should know: what occupancy rate do you need to cover all your costs? Visual chart with red/green zones. Updates live as you move the slider.

Full Operating Cost Layer

Mortgage, insurance, HOA, utilities, internet, cleaning, laundry, supplies, property management fee, maintenance reserve — every cost category that most calculators skip entirely.

12-Month Seasonal Planner

Plan your full year with custom occupancy and rate assumptions per month. See which months are profitable, which need a rate adjustment, and what your annual total looks like before it happens.

VRBO Subscription Optimizer

Should you pay VRBO per-booking (8%) or buy the annual subscription ($499/year)? The break-even is $9,980 in annual VRBO revenue. This tool shows you exactly where you stand.

Multi-Property Portfolio CSV

Upload a CSV with multiple properties. Get calculated monthly profit, annual projection, and break-even occupancy for your entire portfolio. Export results as CSV.

See It In Action

Watch the Tool Work — In Real Time

Click any preview to expand. No sign-up required to try the tool.
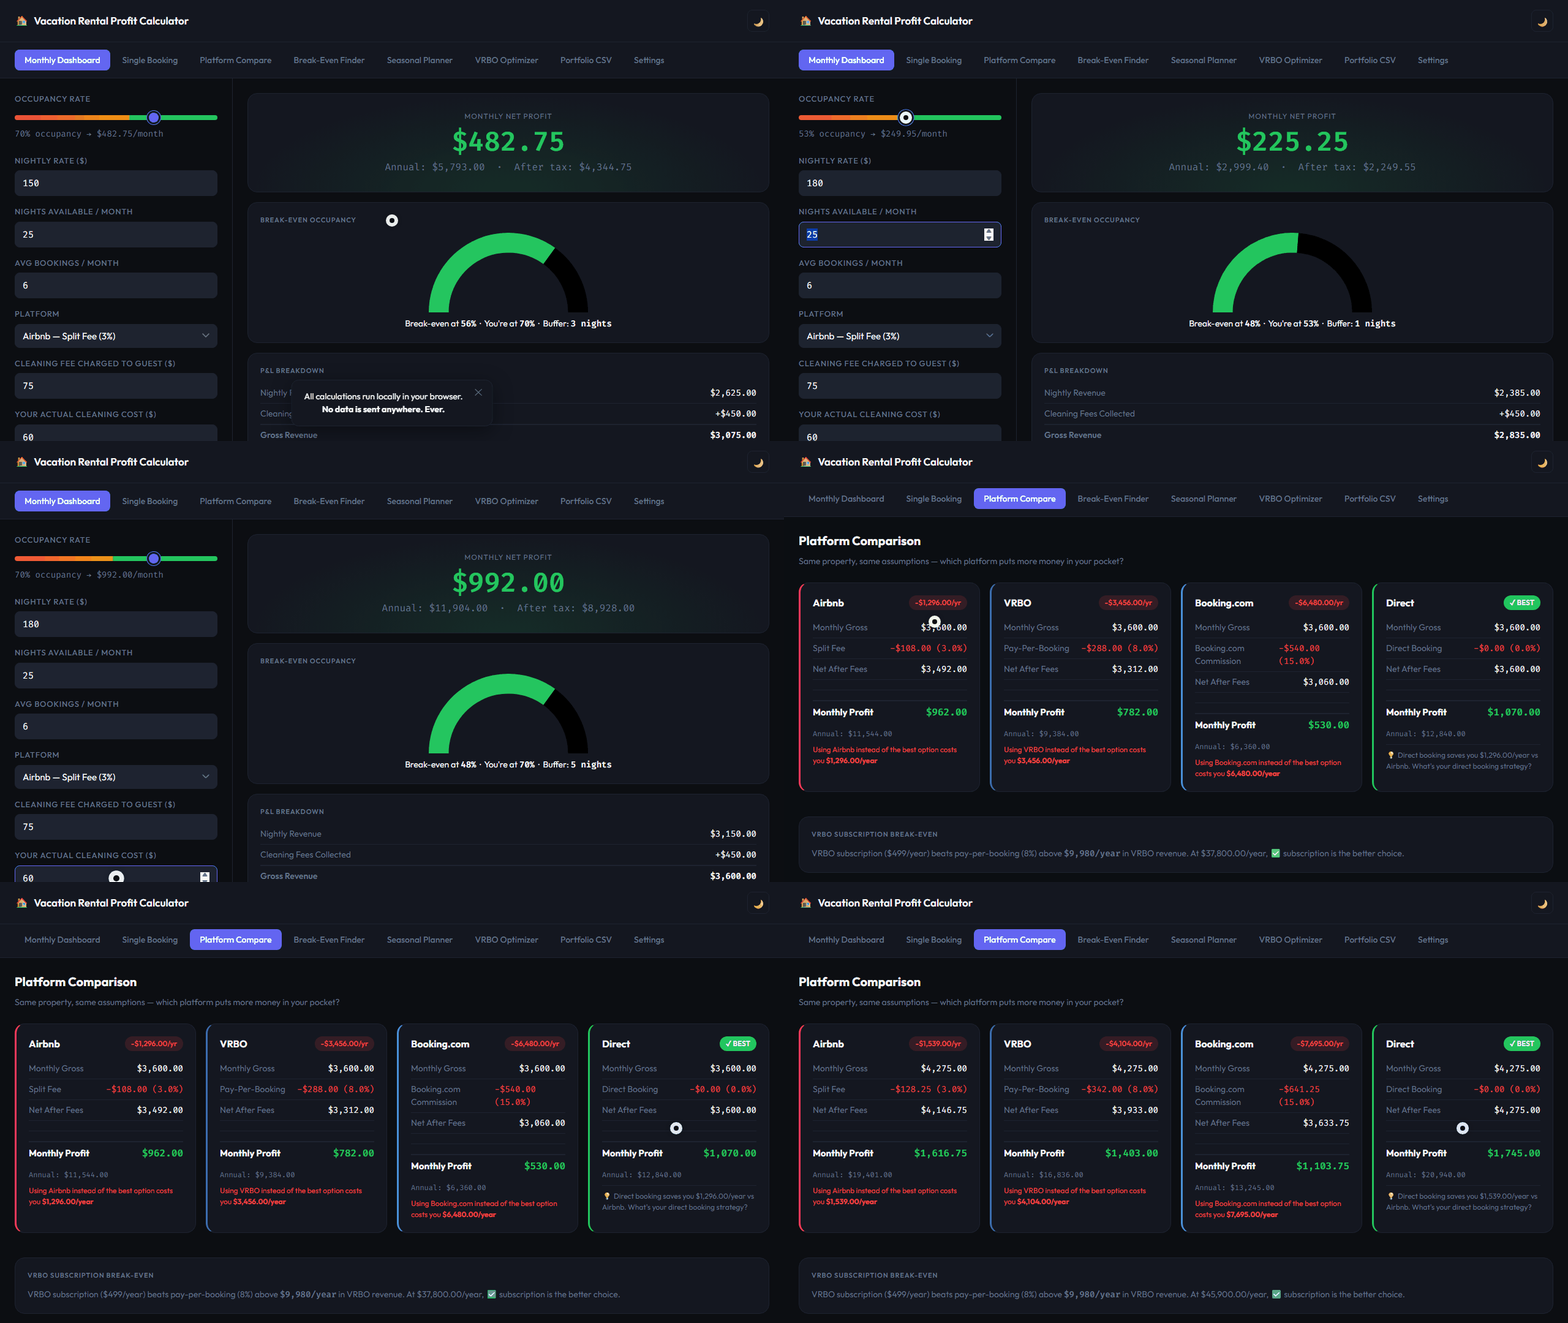
Vacation rental profit calculator demo — monthly dashboard and platform comparison

DEMO 01 / 02

Monthly Dashboard & Platform Comparison

Enter your nightly rate, drag the occupancy slider, and watch your monthly profit update instantly. Switch to Platform Compare to see Airbnb vs VRBO vs Booking.com side by side.
Live Slider Platform Comparison Real-Time P&L
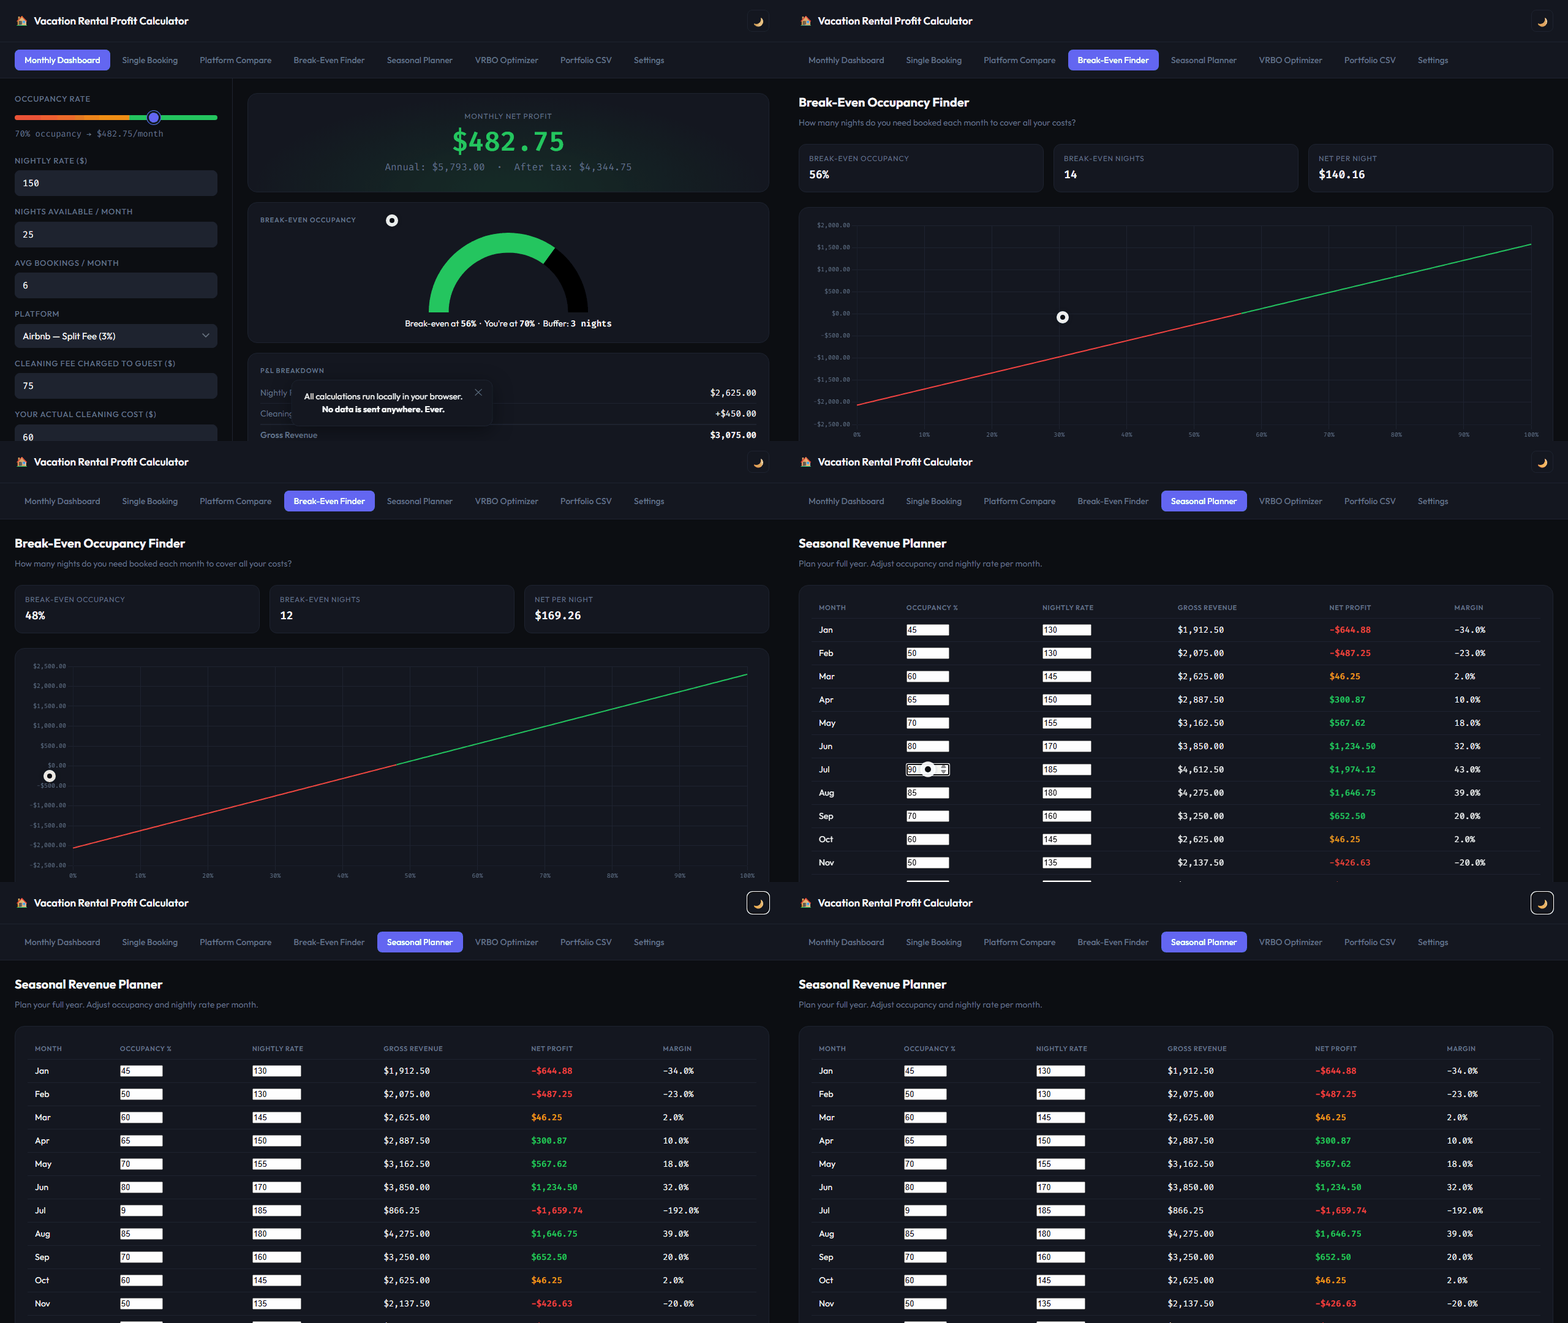
Vacation rental break-even occupancy calculator demo and 12-month seasonal planner

DEMO 02 / 02

Break-Even Finder & Seasonal Planner

Discover the exact occupancy rate you need to cover all your costs. Then plan your full year — month by month — with the 12-month seasonal revenue projector.

Break-Even Chart 12-Month Planner Occupancy Gauge

Open the File. See Your Profit.

Download & Open in 30 Seconds

Download the single HTML file. No installation. No account. No internet connection required after this step.

Enter Your Numbers

Nightly rate, occupancy, platform, mortgage, cleaning costs. The occupancy slider updates every number on screen in real time.

Know Your Break-Even

See your monthly net profit, annual projection, and the exact occupancy rate you need to cover every cost. Compare platforms. Plan your year.

Built for Hosts Who Want the Real Number

Great fit
  • Airbnb hosts on split fee (3%) or host-only (15.5%)
  • VRBO hosts on pay-per-booking or annual subscription
  • Booking.com hosts with or without Genius program
  • Hosts considering direct bookings to eliminate platform fees
  • Vacation rental investors evaluating a new property
  • Property managers running portfolios of 2–15 properties
  • B&B owners comparing platform options
  • Hosts who want to know their break-even before listing
Not the right fit
  • Hotel chains with 100+ properties
  • Hosts who need live market data (AirDNA is better for that)

Frequently Asked Questions

The formula is: Gross Revenue (nightly rate × nights + cleaning fee collected) minus Airbnb's host fee (3% split-fee model or 15.5% host-only model), minus occupancy taxes if you're responsible for them, minus your actual operating costs: cleaning labor, supplies, mortgage, insurance, and utilities. This calculator runs that full formula and shows you the result instantly.
Break-even occupancy rate is the minimum percentage of nights you need to book each month to cover all your costs — platform fees, mortgage, insurance, utilities, and per-booking expenses. For most urban properties with a mortgage, this falls between 40–65%. This calculator shows your exact number and visualizes it as a gauge against your current occupancy rate.
It depends on your nightly rate and booking volume. Airbnb's split-fee model costs hosts 3% (guests pay ~14% on top). VRBO costs 8% total (5% + 3% payment). Booking.com charges 15% commission. At lower booking volumes, VRBO pay-per-booking often wins. At higher volumes, Airbnb split-fee typically nets more. The Platform Comparison tab shows you the exact annual difference for your specific numbers.
Yes — Airbnb auto-remits occupancy taxes in 40+ US states and many countries. If Airbnb collects in your area, you do not deduct this from your income (it never hits your account). This calculator includes a toggle: "auto-collected" means it's excluded from your cost calculation.
100%. After the initial page load (which fetches Chart.js and fonts from CDN), the tool works with no internet connection. All calculations run locally in your browser. Your financial data never leaves your device.
The VRBO annual subscription ($499/year) breaks even against pay-per-booking (8%) at approximately $9,980 in annual VRBO revenue. Above that threshold, the subscription saves you money. Below it, pay-per-booking costs less.
Start with the gross booking value — nightly rate × nights, plus the cleaning fee you collect. Then subtract each platform's host fee: Airbnb takes a 3% host fee (guests pay roughly 14% on top, separately), VRBO takes 8% on pay-per-booking (5% commission + 3% payment processing), and Booking.com takes a flat 15% commission. Whatever remains is your net payout for that booking. The free comparison near the top of this page runs all three side by side.
No. On Airbnb's split-fee model the guest service fee (around 14%) is charged to the traveler on top of your price and never touches your payout — only the 3% host fee is deducted from what you receive. That is why Airbnb often nets the most per booking in the comparison above, even when the guest's total looks higher. VRBO and Booking.com instead fold their cost into a larger host-side commission.
No — and that is deliberate. The comparison above is a fast, one-booking snapshot of platform fees only. The full downloadable calculator builds the complete picture: monthly profit and loss with operating costs and taxes, 12-month seasonal planning, break-even occupancy, the VRBO subscription optimizer, and multi-property bulk CSV import and export. Use the mini comparison for a single stay; use the full tool to run your whole business.

More Free Tools for Online Sellers & Business Owners

All tools by Smart Local Tools — offline, no subscription, no account

Related Guides for Vacation Rental Hosts

Important Disclaimer

This tool is designed to assist vacation rental hosts in estimating potential income, costs, and profitability based on user-provided inputs and publicly available platform fee data. It is intended as a decision-support aid only.

All calculations are estimates. Actual results will vary based on local market conditions, platform fee changes, occupancy performance, regulatory requirements, and individual property characteristics. Platform fee structures (Airbnb, VRBO, Booking.com) may change at any time — always verify current rates directly with each platform before making financial decisions.

This tool does not constitute financial, tax, legal, or investment advice. Users are solely responsible for all decisions made based on this tool's output. Smart Local Tools accepts no liability for financial outcomes resulting from the use of this calculator.